

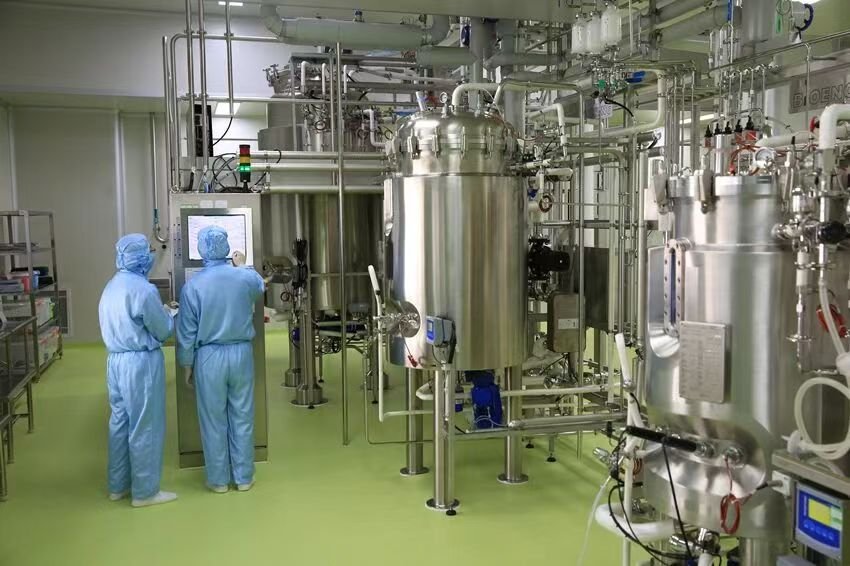
New practitioners of fermentation often hold a misconception: the more numerical readings displayed on a bioreactor control system, the more comprehensive oversight they gain over cultivation workflows. However, process success is never determined by the volume of logged data, but rather whether such datasets faithfully reflect the physiological state of microbial cells. All online measurement signals originate from a suite of sensors mounted on bioreactors. These transducers capture physical and chemical properties within the culture broth, transmit signals via transmitters and data acquisition modules to distributed control systems (DCS), and ultimately generate real-time trend curves for operators to interpret. Mastering these sensors entails far more than grasping their working principles; crucially, engineers must identify conditions prone to signal distortion, measurement drift, and erroneous process judgements induced by unreliable readings.
1. Temperature Sensors
Temperature is universally monitored across all fermentation setups, yet it remains the most frequently underestimated online parameter. Many process specialists assume a steady controller readout of 36 °C guarantees a uniform broth temperature of 36 °C throughout the bioreactor. In reality, this value only reflects the temperature at the sensor’s installation point rather than the bulk average of the entire culture system. This discrepancy amplifies drastically upon production scale-up, ranging from tens-of-liter pilot bioreactors to multi-ton industrial fermenters, where homogeneity is rarely maintained. Continuous metabolic heat generation by microbes, heat removal through jacket cooling, and heat redistribution driven by agitation create persistent thermal gradients. Reduced mixing efficiency, elevated broth viscosity, and localized flow field disturbances all induce measurable temperature disparities across distinct zones within a single bioreactor.
Industrial fermentation predominantly employs Pt100 platinum resistance temperature detectors (RTDs) for thermal measurement. The underlying mechanism relies on the predictable linear correlation between platinum resistance and temperature: temperature variations are converted into resistance signals, which transmitters subsequently convert into digital outputs. Compared with thermocouples, Pt100 RTDs deliver superior repeatability, long-term stability, and high measurement precision, rendering them the industry standard for modern bioprocess equipment. On bioreactors, Pt100 elements are never submerged directly in culture media; instead, they are housed inside welded thermowells. This design withstands 121 °C steam-in-place (SIP) sterilization and facilitates sensor replacement without breaking sterility. Nevertheless, the thermowell introduces thermal lag: heat transfer from broth to the sensing element is delayed by thick well walls, entrapped air gaps, or poor thermal conductivity. This delay is negligible in lab-scale 5 L bioreactors due to small liquid volumes and vigorous fluid circulation that homogenize temperatures instantaneously, yet thermal hysteresis becomes increasingly pronounced with equipment scale-up.
A commonly overlooked field issue concerns sensor placement. While the theoretical objective is bulk broth temperature measurement, poorly positioned probes yield misleading localized readings. Sensors mounted adjacent to cooling jackets, coolant inlet ports, or stagnant mixing dead zones capture microclimate temperatures instead of representative bulk values. Consequently, identical displayed temperature setpoints can correspond to divergent actual broth temperatures across equipment from different manufacturers or with alternative probe mounting layouts.
Numerous technical documents highlight four-wire Pt100 configurations for enhanced precision—a valid claim prone to misinterpretation. Four-wire wiring eliminates measurement errors stemming from cable resistance rather than governing overall system accuracy. Large-scale bioprocess facilities feature cabling runs of tens to over one hundred meters between sensors and control cabinets; ambient temperature fluctuations alter the inherent resistance of signal cables, which two-wire architectures cannot distinguish from Pt100 element resistance. Four-wire designs deploy two conductors for constant-current excitation and two independent leads for voltage detection, nearly eliminating cable-induced bias. Even so, the ultimate precision of a temperature measurement system hinges on multiple factors: Pt100 element classification, transmitter performance, data acquisition module resolution, and standardized calibration protocols—not merely four-wire wiring.
Experienced fermentation engineers do not immediately tune PID control parameters upon detecting a 0.2 °C temperature deviation. Instead, they first troubleshoot root causes: loose probe fittings, fouled thermowell surfaces, incomplete calibration, and suboptimal installation geometry. For biomanufacturing, accurate measurement always takes priority over rapid closed-loop control response.
2. pH Electrodes
Industrial bioprocesses rely on combined glass pH electrodes for continuous online pH quantification, functioning as integrated electrochemical analytical assemblies comprising a glass indicator electrode and a reference electrode. The selective permeability of the glass membrane to hydrogen ions generates a potential difference proportional to H⁺ activity across the membrane interface; high-impedance transmitters amplify this micro-potential signal and convert it into digital pH readouts within control platforms.
Textbooks introduce the Nernst equation, which predicts a ~59 mV potential shift per pH unit at 25 °C. While this theoretical foundation is essential, practicing process engineers prioritize resolving a pervasive field challenge: electrodes passing pre-run calibration often produce progressively inaccurate readings mid-fermentation, a phenomenon driven entirely by complex culture broth matrices. Media components including proteins, polysaccharides, lipids, cellular debris, and diverse metabolic byproducts continuously adsorb onto the glass membrane and liquid junction, hindering ion exchange. Accumulated fouling slows electrode response, drifts zero offset, and compounds cumulative measurement error. Concurrently, repeated 121 °C SIP cycles accelerate glass membrane aging and deplete internal electrolyte within reference electrodes, destabilizing reference potential. Newly installed electrodes exhibit sharp, rapid signal responses, yet after dozens of sterilization cycles, substantial measurement lag persists even following successful two-point calibration.
A ubiquitous operational symptom illustrates this degradation: ammonia feed addition triggers no immediate pH curve shift, followed by an abrupt steep pH rise several minutes later; alternatively, pH continues drifting upward long after alkali dosing ceases. Operators frequently suspect faulty control logic, yet electrode response retardation constitutes the primary root cause. When analyzing pH trends, standalone curve interpretation yields limited insight—cross-referencing with complementary online parameters is mandatory. Concurrent pH decline, rising off-gas CO₂, and falling dissolved oxygen (DO) signal robust microbial metabolic activity. Isolated pH fluctuations unaccompanied by shifts in temperature, DO, or exhaust gas composition indicate compromised electrode health, warranting sensor inspection prior to process parameter adjustments.
Robust electrode maintenance far exceeds basic operator expectations. Standard two-point buffer calibration represents only baseline upkeep; sustained monitoring of electrode slope, zero drift, and response time is paramount. Gradually diminishing slope and decelerated signal kinetics signal imminent sensor failure, even if calibration can still be completed. Under such conditions, every pH value logged by the control system deviates further from true broth pH over cultivation duration.
3. Dissolved Oxygen (DO) Electrodes
If fermentation engineers could retain only one online monitoring parameter, dissolved oxygen would be the overwhelming choice. Microbes consume oxygen constantly throughout cultivation, and oxygen supply capacity directly dictates cellular metabolic throughput. For nearly all aerobic fermentation workflows, DO trends trace every critical cultivation stage: inoculation, exponential growth, fed-batch feeding, biomass accumulation, and target metabolite biosynthesis. This ubiquity leads novice operators to misclassify DO as a direct “cellular vitality gauge.” A falling DO reading is automatically interpreted as robust microbial proliferation, while rising DO is incorrectly attributed to compromised cell physiology. In reality, DO reflects the dynamic equilibrium between oxygen supply and cellular oxygen consumption rather than a standalone marker of microbial activity.
A classic fed-batch fermentation example illustrates this principle: stable DO maintained at 30% air saturation may abruptly surge to 80–100%. Most operators attribute this jump to enhanced oxygen delivery, yet the underlying driver is frequently interrupted carbon feed or glucose depletion. Starved microbes drastically reduce oxygen uptake rates without any increase in aeration capacity, elevating dissolved oxygen concentrations within the broth. Resuming carbon feed restores cellular metabolic demand, triggering a rapid DO decline. DO fluctuations therefore quantify oxygen supply-demand balance, not aeration performance in isolation.
Polarographic DO electrodes represent the dominant industrial sensing architecture. Core hardware includes a platinum cathode, silver/silver chloride (Ag/AgCl) anode, and an outer gas-permeable membrane. A fixed polarizing voltage is applied during operation; oxygen diffuses across the membrane into the electrode internal cavity and undergoes reduction at the cathode, generating a micro-diffusion current proportional to dissolved oxygen partial pressure. Transmitters convert this current signal into standardized DO outputs. A widespread misunderstanding persists regarding sensor functionality: electrodes do not directly measure volumetric oxygen concentration in broth. Instead, they detect current correlated to oxygen partial pressure, which control systems normalize to percentage air saturation post-calibration or convert to mg L⁻¹ O₂ using temperature and pressure compensation. Identical 50% DO saturation readings correspond to distinct actual dissolved oxygen concentrations under differing temperature and hydrostatic pressure regimes, necessitating full pre-fermentation recalibration for each batch.
Standard calibration protocols establish a 100% saturation baseline under fixed agitation and aeration with ambient air, while zero-point calibration employs nitrogen purging or sodium sulfite oxygen scavenging. Despite validated pre-run calibration, logged DO data remains subject to interpretive bias stemming from intrinsic sensor response lag. Oxygen must diffuse sequentially through bulk broth, the outer permeable membrane, and internal electrode layers before electrochemical conversion, creating unavoidable signal delay. Modern optical fluorescence DO probes deliver drastically accelerated response kinetics, whereas traditional polarographic electrodes exhibit T90 response times spanning tens of seconds. This lag exerts minimal influence over small-volume 5 L lab bioreactors, yet during high-cell-density cultivation, tens of seconds suffice to drive profound metabolic shifts. Operators often misattribute delayed DO feedback to unstable PID control rather than inherent sensor hysteresis.
DO readings are additionally highly susceptible to broth flow field characteristics. Reduced agitation speed or elevated broth viscosity decelerates fluid renewal surrounding the probe, thickening the oxygen diffusion boundary layer at the membrane interface. Even with uniform bulk DO concentrations across the bioreactor, localized oxygen depletion adjacent to the sensor suppresses measured saturation values. This artifact is particularly pronounced in high-viscosity fungal fermentation and high-density mammalian cell culture, rendering raw DO readings disproportionately sensitive to fluid rheology relative to actual cellular microenvironment oxygen levels. Veteran process engineers never analyze DO trends in isolation; they cross-evaluate DO alongside feed rates, air flowrates, off-gas oxygen and carbon dioxide concentrations to accurately diagnose microbial metabolic shifts.
4. Pressure Transmitters
Compared with temperature and DO monitoring, bioreactor headspace pressure receives less operator attention, frequently reduced to a safety overpressure alarm parameter requiring static setpoint maintenance. In truth, headspace pressure exerts cascading impacts on all gas-phase online measurements, most notably dissolved oxygen solubility. A common operational observation exemplifies this relationship: boosting headspace pressure from 0.03 MPa to 0.05 MPa to augment oxygen transfer generates an immediate DO spike. Many operators misinterpret this as suppressed cellular oxygen consumption, yet elevated hydrostatic pressure simply increases the equilibrium solubility of oxygen within aqueous culture media. Neglecting pressure variations during DO data analysis inevitably yields erroneous metabolic conclusions.
Industrial fermenters utilize diaphragm-sealed pressure transmitters for headspace quantification. Given repeated 121 °C SIP sterilization cycles, direct contact between hot broth and sensitive sensing elements is prohibited, necessitating flexible isolation diaphragms. Broth pressure deforms the diaphragm, and incompressible filling fluid transfers mechanical pressure to internal measurement transducers, shielding core hardware from high-temperature, humid bioprocess environments. Sensor hardware rarely constitutes the primary source of measurement inaccuracy; flawed installation geometry drives most signal artifacts. Tap points positioned within zones prone to steam condensation accumulate static liquid columns that introduce offset pressure readings, while sampling ports facing impeller turbulent flow superimpose fluid pulsations onto pressure signals, creating erratic, noisy trend curves. Premium industrial bioreactor designs mitigate these artifacts by siting pressure taps outside high-turbulence regions and minimizing condensate accumulation.
Beyond safety interlocks, headspace pressure underpins critical mathematical calculations for bioprocess characterization: DO calibration compensation, off-gas component concentration normalization, volumetric oxygen mass transfer coefficient (kLa) computation, and estimation of oxygen uptake rate (OUR) and carbon dioxide evolution rate (CER). While pressure itself may not qualify as a primary diagnostic parameter, omitting pressure correction skews the validity of all gas-derived analytical datasets.
5. Agitation Speed Sensors
Agitation rotational speed constitutes one of the most dynamically modulated control variables across fermentation workflows. Operators often classify it as a purely mechanical parameter, yet stirrer rpm governs bulk mixing uniformity, volumetric oxygen transfer efficiency, heat exchange performance, and fluid shear stress exerted on microbial cells. When DO concentrations decline below set thresholds, control systems most commonly increase stirrer speed to restore saturation. Elevated agitation intensifies broth circulation, fragments inlet gas bubbles into finer dispersions, expands gas-liquid interfacial area, raises kLa values, and stabilizes DO at target setpoints. Consequently, stirrer speed modulation forms the core of most DO feedback control architectures.
Industrial bioreactors deploy Hall-effect or magnetoresistive sensors for rotational speed quantification. Magnetic steel gears or embedded permanent magnets mounted on the agitator drive shaft generate a fixed number of electrical pulses per full rotation. Control systems calculate real-time rpm by counting pulse frequency over standardized sampling intervals. This pulse-counting methodology delivers exceptional mechanical reliability, yet a critical interpretive caveat persists: a controller readout of 800 rpm does not guarantee equivalent mixing performance corresponding to 800 rpm at inoculation. As microbial biomass accumulates, broth apparent viscosity rises substantially—an effect amplified in filamentous fungi, actinomycete, and high-density mammalian cell cultivations that drastically alter fluid rheological behavior. An identical 800 rpm stirrer speed generates fully turbulent flow at early-stage low viscosity, yet viscous dissipation consumes most mechanical power late in the batch, severely degrading mixing homogeneity. For large-scale industrial fermenters, skilled process engineers prioritize volumetric power input, oxygen transfer capacity, and cellular shear exposure over raw rotational speed values to validate cultivation suitability.
6. Off-Gas Analyzers
Whereas DO reflects oxygen supply-demand equilibrium within liquid broth, off-gas analysis delivers direct readouts of whole-batch cellular respiratory activity. Adoption of exhaust gas analyzers has accelerated across modern bioprocess facilities, driven by their unique ability to quantify metabolic signatures inaccessible via liquid-phase sensors.
Microbes continuously consume oxygen and excrete carbon dioxide during proliferative metabolism, so declining off-gas O₂ mole fractions and rising CO₂ concentrations serve as unambiguous markers of active cellular physiology. A key advantage of off-gas monitoring over liquid-phase sensors is insensitivity to electrode fouling, broth viscosity gradients, and localized flow field heterogeneity; exhaust gas compositional data approximates the average metabolic state of the entire culture volume.
Contemporary off-gas analytical hardware employs paramagnetic oxygen detectors, leveraging the paramagnetic physical property of O₂ molecules for gas-phase oxygen quantification. Carbon dioxide concentrations are measured via non-dispersive infrared (NDIR) spectroscopy, exploiting characteristic infrared absorbance at the 4.26 μm wavelength band. Both analytical modalities deliver outstanding long-term stability, cementing their dominance in industrial fermentation workflows. The greatest analytical value of exhaust gas monitoring extends far beyond raw O₂ and CO₂ readings, however—derived respirometric parameters constitute core outputs of Process Analytical Technology (PAT) and intelligent biomanufacturing platforms: oxygen uptake rate (OUR), carbon dioxide evolution rate (CER), and respiratory quotient (RQ = CER / OUR). These metrics directly quantify microbial carbon flux and metabolic pathway utilization.
Process engineers frequently encounter this field scenario: stable DO saturation coexists with a sustained downward drift in off-gas CO₂ concentration. This decoupling signals declining cellular metabolic activity rather than constrained oxygen delivery. Retaining unmodified carbon feeding protocols under such conditions triggers substrate accumulation and severe metabolic imbalance. Accordingly, off-gas monitoring has evolved from supplementary auxiliary measurement to a primary diagnostic pillar within smart fermentation control architectures. Elite process specialists never draw conclusions from isolated trend curves; they overlay DO, off-gas composition, aeration flowrate, feed addition rates, and stirrer speed onto unified multivariate trend plots. No single sensor can fully characterize fermentation dynamics—accurate process interpretation relies on correlative relationships between multiple complementary online datasets.
7. Biomass Sensors
For fermentation specialists, real-time biomass concentration ranks as the most sought-after online measurement parameter, yet continuous in-situ biomass quantification remains one of bioprocessing’s most persistent analytical bottlenecks. Laboratory-scale offline biomass quantification relies on discrete sampling to measure OD₆₀₀ absorbance, wet cell weight, dry cell weight, or viable colony-forming units (CFU), which are subsequently plotted to generate growth curves. While these offline assays deliver high analytical accuracy, they suffer from inherent temporal lag: by the time results are generated, cellular physiological conditions have already shifted dramatically.
For high-cell-density cultivation, a gap of several hours suffices to transition cultures from exponential growth to stationary phase. Strictly regulated metabolic control workflows feature narrow feeding windows of merely 10–20 minutes; reliance on manual offline sampling inevitably misses critical process intervention thresholds. For this reason, continuous online biomass monitoring represents a longstanding priority for bioprocess research and industrial implementation.
Two primary sensing modalities dominate current industrial in-situ biomass quantification: optical turbidity probes and capacitance-based sensors. Optical detection operates on straightforward light scattering and absorbance principles: rising microbial cell density attenuates light transmission through the broth, and calibrated models convert light intensity attenuation signals to equivalent cell concentration values. This technology performs reliably for homogeneous unicellular cultures (E. coli, yeast), explaining widespread deployment of online OD/turbidity probes on lab-scale bioreactors. Performance deteriorates drastically upon industrial scale-up, however. Optical signal interference arises from multiple broth matrix components unrelated to biomass: suspended microbubbles, pigmented media, precipitated proteins, filamentous cell aggregates, and intrinsic color shifts of fermentation substrates. This limitation is exacerbated for filamentous fungi and actinomycetes, whose tangled mycelial pellets generate entirely distinct light-scattering profiles compared with spherical unicellular microbes. Identical optical absorbance readings can correspond to drastically divergent actual biomass loads. Consequently, online optical turbidity signals represent biomass-correlated process variables rather than absolute cell concentration measurements.
Capacitance-based in-situ biomass probes have gained traction for industrial high-density cultivation, operating independently of optical transmission principles. The underlying mechanism exploits the dielectric capacitive properties of intact live cell plasma membranes. When alternating electric fields are applied across the culture volume, viable cells with complete lipid bilayers polarize and generate measurable dielectric responses, while dead cells, soluble media components, and inorganic particulate matter produce negligible capacitance signals. Capacitance probes therefore quantify exclusively intact viable cell populations, in stark contrast to bulk optical turbidity or dry weight measurements. This fundamental divergence explains frequent apparent discrepancies between capacitance and offline OD readings: the two technologies quantify distinct biological analytes, with capacitance selectively reporting metabolically active viable biomass.